Visualizers
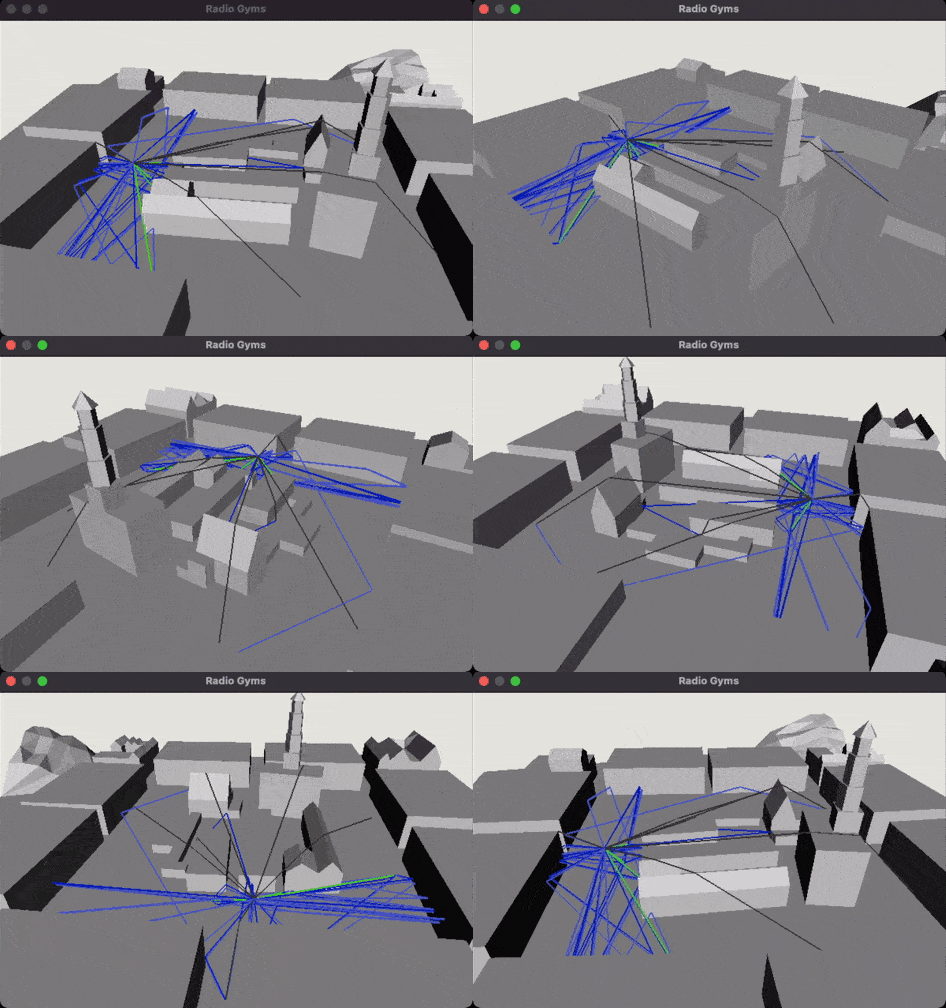
There are two type of virualizer provided in Radio Gyms. The first vistualizer is for a window and the second is for a notebook.
Window
As we obtain the traced paths from the tracer, we can convert these paths into lines for the visualization.
Window() can be called to read the lines and the scene to visualize the scene in 3D by window.run().
import numpy as np
from radio_gyms.visualizers import Window
from radio_gyms.engines.ray_tracer.tracer import Tracer
from radio_gyms.utils import OutdoorResultToLines

MAT_OBJ_PATH = "./city.obj

window = Window()
window.load_obj_to_scene(MAT_OBJ_PATH)
tracer = Tracer(MAT_OBJ_PATH)
tx_pos = np.array([0, 5, 0])
lines = []
while True:
    rx_pos = (np.random.rand(3)*2-1)*100
    rx_pos[1] = 1.2
    if tracer.is_outdoor(rx_pos):
        break
result = tracer.trace_outdoor(tx_pos, rx_pos)
lines = lines + OutdoorResultToLines(result, tx_pos, rx_pos)
window.line_sets = lines
window.run()
With the .run() The camera can be moved by W A S D keys and rotated by Q E.

Plotter
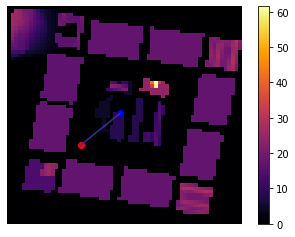
Radio gyms can be visualized on a notebook in 2D by using utils.Plotter.
Plotter() requires definition of boundary of the map to visualize. The parameters such as points and lines can be passed to Plotter to visualize the data.
from radio_gyms.engines import Tracer
from radio_gyms.utils import Plotter, OutdoorResultToLines
MAP_SCENE = "./city.obj"

tracer = Tracer(MAP_SCENE)
rx = [0, 1.2, 0]
tx = [-50, 4, 40]
result = tracer.trace_outdoor(tx, rx)
terrain_map = tracer.get_terrain_depth(64, 64)
plotter = Plotter( tracer.min_bound, tracer.max_bound, terrain_map)
plotter.rx_pos.append(rx)
plotter.tx_pos.append(tx)
plotter.lines =  OutdoorResultToLines(result)

plotter.render_top() # Display from top view
